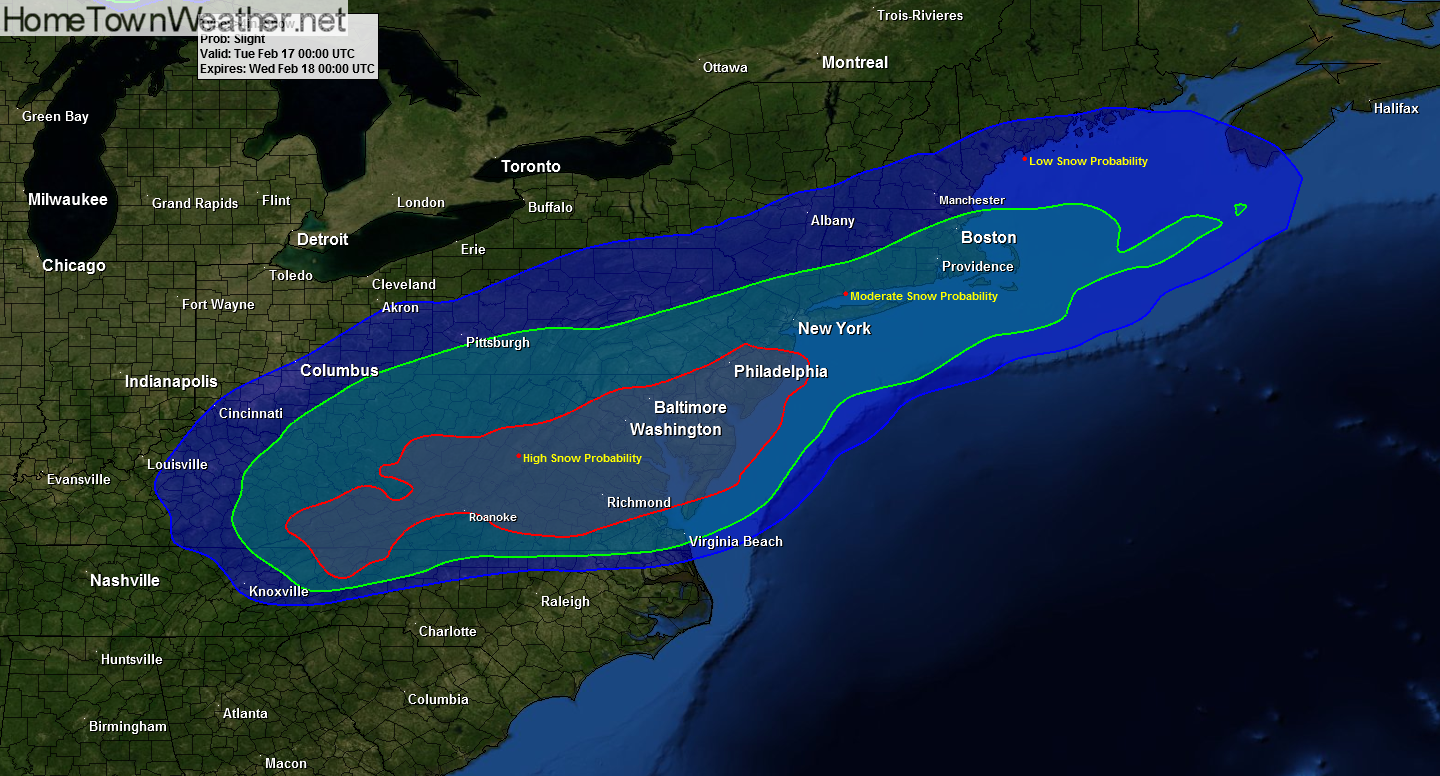
The following graphic shows the probability that and area will get greater then 4 inches of the white stuff in the next 2 days. The RED outlined area is HIGH. The GREEN area is MODERATE and the BLUE area is SLIGHT.

The following graphic shows the probability that and area will get greater then 4 inches of the white stuff in the next 2 days. The RED outlined area is HIGH. The GREEN area is MODERATE and the BLUE area is SLIGHT.