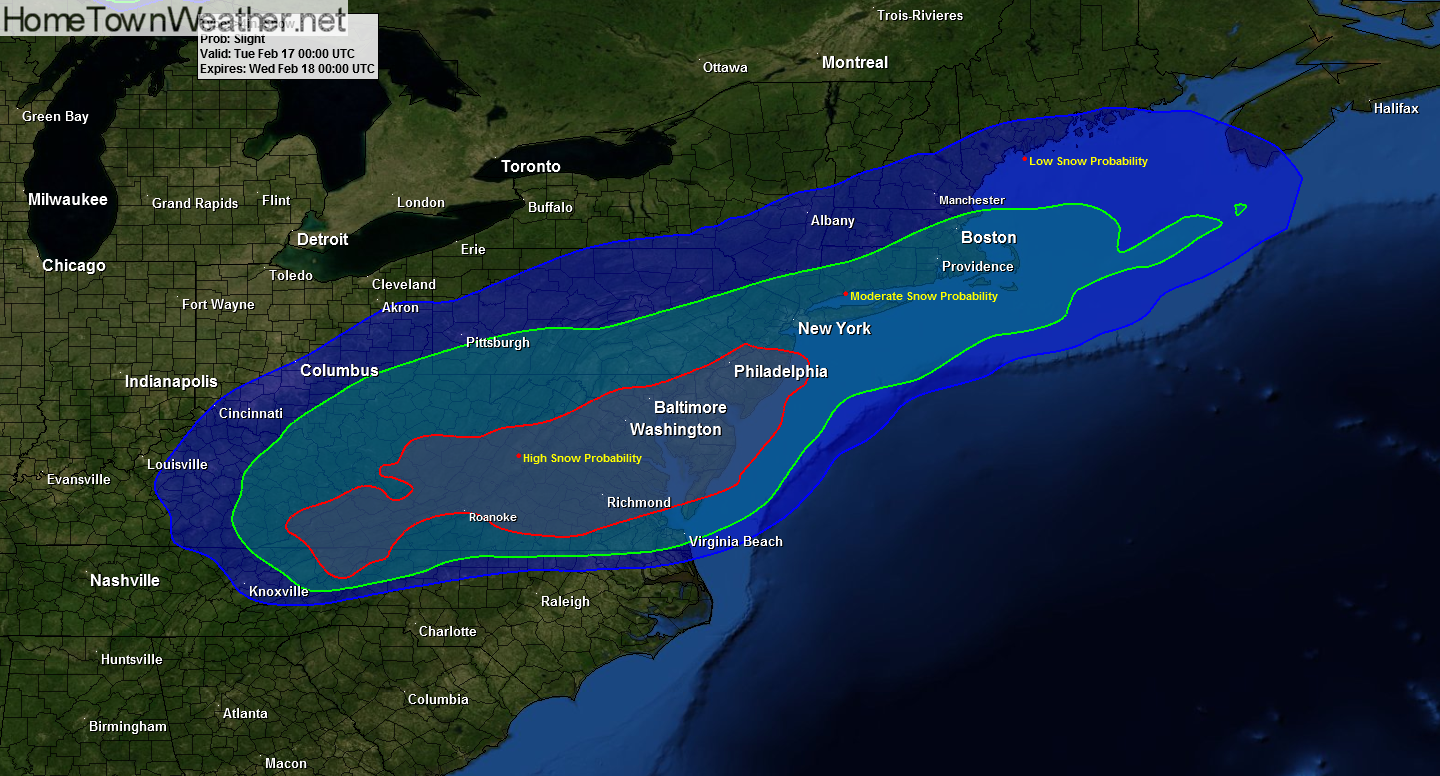
The following graphic shows the probability that and area will get greater then 4 inches of the white stuff in the next 2 days. The RED outlined area is HIGH. The GREEN area is MODERATE and the BLUE area is SLIGHT.

The following graphic shows the probability that and area will get greater then 4 inches of the white stuff in the next 2 days. The RED outlined area is HIGH. The GREEN area is MODERATE and the BLUE area is SLIGHT.
The graphic gives you an idea where the most snow will fall the next 2 days.