This is a monthly graph of the ENSO from 2020 through 2021. Negative is trending towards El Nino and Positive is trending towards La Nina. Near 0 means Neutral. that is right where we are right now. You can clearly see the positive trend during the peak of the hurricane season last year (La Nina). Right now we are near neutral and the new models expect us to stay that way through the peak of hurricane season. Still points to an active season, but nothing like last year.
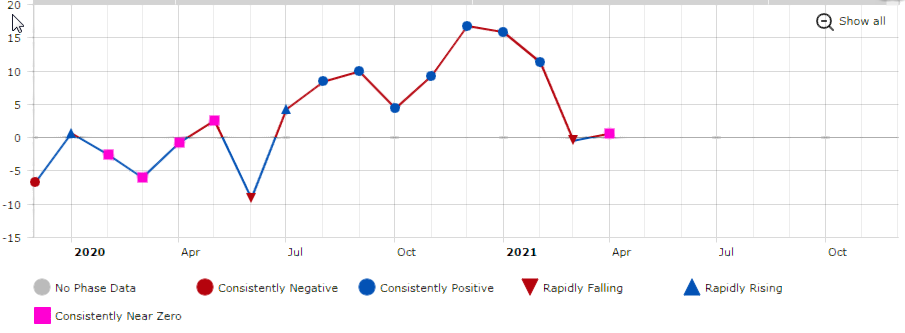
The SOI (Southern Oscillation Index ) is a huge barometer as to how busy a hurricane season might be. Essentially, this is how warm or cold the Pacific waters are in the tropical ENSO regions. The SOI is calculated from the difference in pressure between Darwin and Tahiti. These pressure differences control what direction the trade winds blow in the tropical Pacific. The direction of these trade winds help determine how warm or cold those waters will be.
Like
Comment